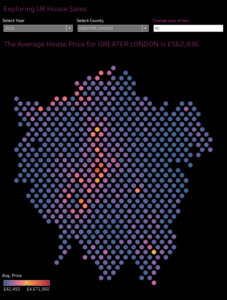
Week 10. Another week’s challenge, and another oh so close reconstruction of the visualization. Here, I set a personal best to re-creating the entire dashboard; except it took me over an hour to get the ‘size of hex’ parameter to work.
Firstly, the easier parts:
- This required custom shapes, namely a hexagon. I’d already one in my custom shapes folder, but if you’ve never used custom shapes, it’s quite easy. All you need is a shape, and to drop that folder in Documents > My Tableau Repository > Shapes (Windows at least)
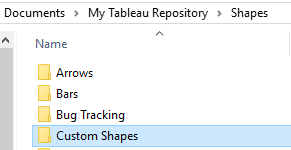
- From here, change the Marks to Shape, and select (from Custom Shapes) the hexagon.
- (Where I went wrong) create calculated fields:
-
Lat Round Round([Latitude], 2)
-
Long Round Round([Longitude], 2)
-
- Add Lat Round to rows and Long Round to columns. Add coloring, filters.
- Finally, add the parameter, created calculated field from parameter, drop to the Size card…. and nothing.
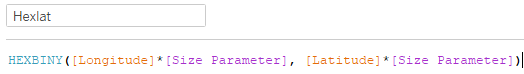
- Commence troubleshooting…. scroll through the function list, again and again, notice nearly an hour has passed… what’s this HEXBINX, HEXBINY? Of course, it’s exactly what’s mentioned here (which is what is linked to on the Week 10 challenge page)
- Here’s what finally solved it for me
 Always something that stumps me! Nice work, Emma!
In all it’s glory (re-sized for the post)