Finally! A week where I got stumped but for less than 5 minutes. A good feeling, but as Andy says, this week will be “pretty easy”. Easy enough, I suppose; still a good mental workout.
The challenge this week was to create one chart with two representations of data; one using a Level of Detail express and the other a Table Calculation.
I’m writing this post simply off my own work; I’ve not yet dared download Andy’s workbook – I want to enjoy the feeling of conquering this weeks’ challenge before I discover how much more elegantly he solved for this. That’s the fun of these challenges and Tableau – multiple paths to solve for the problem at hand.
For both the LOD and Table Calc, I used two calculations to get the final result. I’m curious to see how else this was solved for.
My biggest challenge, and hand on the face moment, was the final label for the Table Calculation. Why oh why could I not get the label to display on the outside of the bar as I’d done with the LOD bars… And then, finally, the idea of the average line. I’ve still never solved why Tableau refers to this as just “Average Line” when it can do so much more.
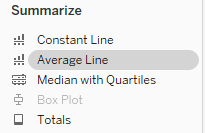
It’s one of those things I forget about… until you need something it can provide, and eventually the mind turns over and gets it.
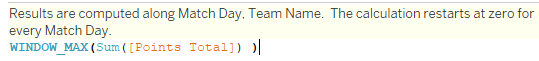
Here are my LOD calculations:
![]()
![]()
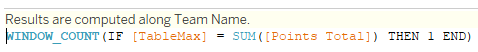
And my Table calcs:
Curious to hear how you’ve solved for this!