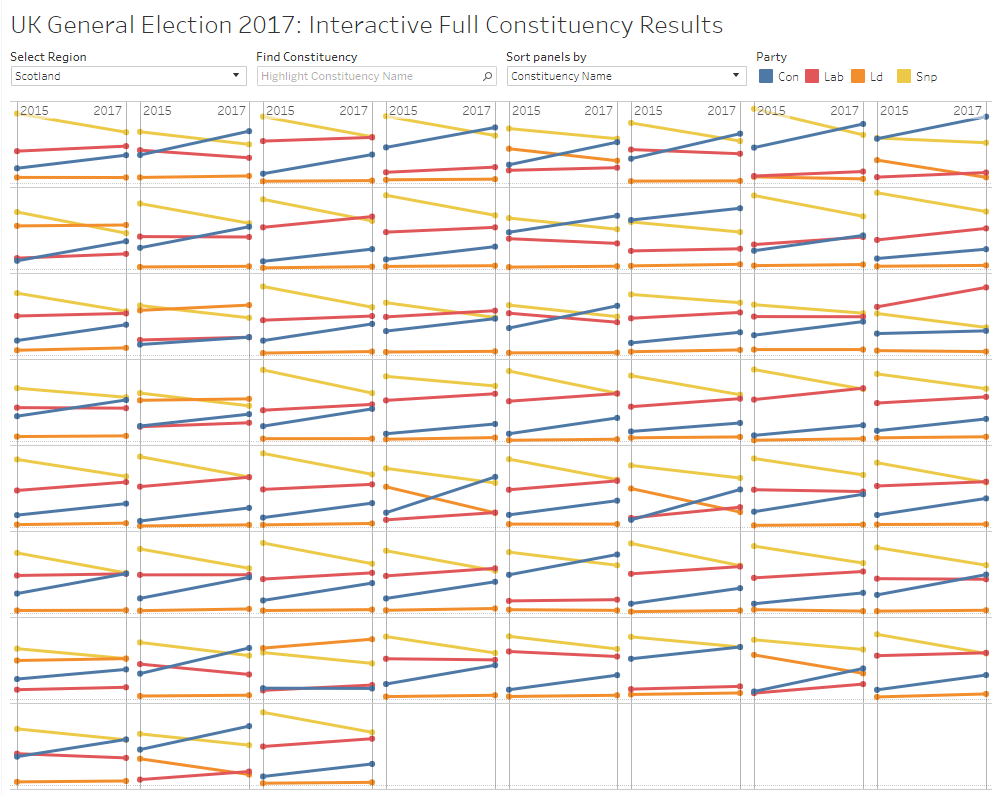
Week 26’s challenge from Emma was a really fun one, and for me expanded my knowledge in very valuable ways. The premise for the week’s challenge was to visualise (British English just in time for the fourth ;)). The overall goal was to create a Trellis chart for each of the Constituencies in each region, and to show the change in overall share by party from 2015 to 2017. Where the challenge really had me thinking I’d get stumped was on the sorting. I’d never implemented a parameter to sort Trellis charts based on the selection, but was ready for the challenge. Here’s the final outcome. Keep reading for how I solved some of the challenges. If you’re new to small multiples/Trellis charts, there’s plenty of resources out there, including the post Andy Cotgreave wrote in 2011.