Monthly Archives

August 2017

In Data Visualization on
August 19, 2017

Week 33 brought forth the challenge of moving the reference date for a Percent Change calculation based on a parameter. Along the way, VizWizBI put in the usual hidden gems and stumpers. The inspiration came from Curtis Harris.

For me, it’s nice to see when I get to the end result and I’ve achieved the same result as the designer of the challenge via different means/methods. I’m not always as efficient, but it certainly proves I’ve not just copied someone else’s work!

First, I needed to figure out the value at the selected parameter date. Here’s where I fumbled the most to start. Eventually I landed on an LOD that got this for me.
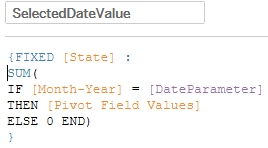
From there, some simple math to get the Percent Change

Reference lines gave me the intersection lines, and I got the dot at that point with this

And here it is!

Cheers!

In Data Visualization on
August 11, 2017

Workout Wednesday Week 32: Continuous Dates

This week’s #WorkoutWednesday challenge (available here) from @EmmaWhyte involved continuous dates. Per usual I figured this to be an easy solve, one that I nearly wanted to give up on, and then all at once the light bulb goes off and we’re rolling. Here’s my solution and the necessary solves.

The tricky bit with continuous dates is that, by their very nature, they move along a continuous line, but the example workbook has them stacked as discrete date parts would be. First thought here, and Year([Order Date]) to color and we’re off. Good start, next add Month([Order Date]) to Columns, switch to Discrete… and fail. Because I’ve got a Discrete Date part on color, it’s segmenting into 4 parts, not stacking. To the drawing board…

The solve here was to create a custom date whereby we ‘trick’ Tableau into putting all into the same year, and because we have the Year on color, it segments into 4 lines. Here’s my custom date (you could pick any year):

DATE("1900-"+STR(MONTH([Order Date]))+"-"+STR(DAY([Order Date])))

The remaining work was rather straighforward (so I found at least), you’ll have to add back the year for the tooltip in a separate calculation, which I did like this:

DATE(STR(YEAR([Order Date]))+”-“+STR(MONTH([Order Date]))+”-“+STR(DAY([Order Date])))

I may have ‘cheated’ as I put my title into a separate sheet and combined in the dashboard, whereas Emma had the title in the same sheet. I find this to be the beauty of the product and challenges is, as with programming, there isn’t one ‘right’ solution – but there may be better/worse ways of arriving at the end goal.