Week 33 brought forth the challenge of moving the reference date for a Percent Change calculation based on a parameter. Along the way, VizWizBI put in the usual hidden gems and stumpers. The inspiration came from Curtis Harris.
For me, it’s nice to see when I get to the end result and I’ve achieved the same result as the designer of the challenge via different means/methods. I’m not always as efficient, but it certainly proves I’ve not just copied someone else’s work!
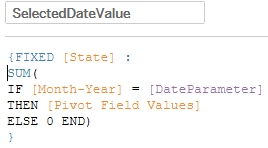
First, I needed to figure out the value at the selected parameter date. Here’s where I fumbled the most to start. Eventually I landed on an LOD that got this for me.

From there, some simple math to get the Percent Change

Reference lines gave me the intersection lines, and I got the dot at that point with this

And here it is!
Cheers!
